本エントリではApache(prefork)のプロセス数でPodを水平オートスケールする手順をまとめます。
大まかな流れとしては、Apache ExporterでPrometheusにメトリクスを収集し、Prometheus AdaptorでHPAにカスタムメトリクスを連携していきます。
- 実行環境
- Prometheusの名前空間を作成
- Helmチャートリポジトリの追加
- Prometheusのインストール
- Apache統計情報の収集
- Prometheus Adapterのインストール
- プロセス数で水平オートスケール
- 参考
実行環境
- Kubernetes(Amazon EKS): 1.18
- helm: 3.4.1
- prometheus-community/prometheus: 14.3.0
- prometheus-community/prometheus-adapter: 2.14.2
- Apache: 2.4
- apache_exporter: 0.9.0
Prometheusの名前空間を作成
$ kubectl create namespace prometheus
Helmチャートリポジトリの追加
# See https://github.com/prometheus-community/helm-charts
$ helm repo add prometheus-community https://prometheus-community.github.io/helm-charts
$ helm repo update
Prometheusのインストール
$ helm upgrade -i prometheus prometheus-community/prometheus \
    --namespace prometheus \
    --set alertmanager.persistentVolume.storageClass="gp2",server.persistentVolume.storageClass="gp2"

$ helm ls -n prometheus
NAME            NAMESPACE       REVISION        UPDATED                                 STATUS          CHART                   APP VERSION
prometheus      prometheus      1               2021-06-29 17:08:33.697191 +0900 JST    deployed        prometheus-14.3.0       2.26.0
Apache統計情報の収集
以下のDeployment apache を例に、 apache コンテナの統計情報をPrometheusに収集するための設定を行なっていきます。
apiVersion: apps/v1
kind: Deployment
metadata:
  name: apache
  labels:
    app: apache
spec:
  selector:
    matchLabels:
      app: apache
  template:
    metadata:
      labels:
        app: apache
    spec:
      containers:
      - name: apache
        ...
Apacheの設定
apache コンテナで次の設定を行います。
mod_statusの有効化
サーバの統計情報を取得するため、 status_module が有効であることを確認します。
# apachectl -M | grep status_module
status_module (shared)
ステータスの公開
localhostからのアクセスのみを対象に、 /server-status でステータスを取得できるように以下の設定を追加します。
<Location "/server-status">
    SetHandler server-status
    Require host localhost
</Location>
メトリクスの収集
Deployment apache にapache-exporterコンテナを追加します。
また、 spec.template.metadata.annotations にapache_exporterがメトリクスを公開するエンドポイントに関する情報を指定します。
apiVersion: apps/v1
kind: Deployment
metadata:
  name: apache
  labels:
    app: apache
spec:
  selector:
    matchLabels:
      app: apache
  template:
    metadata:
      labels:
        app: apache
      annotations:
        prometheus.io/scrape: 'true'
        prometheus.io/port: '9117'
        prometheus.io/path: /metrics
    spec:
      containers:
      - name: apache-exporter
        image: bitnami/apache-exporter:0.9.0
      - name: apache
        ...
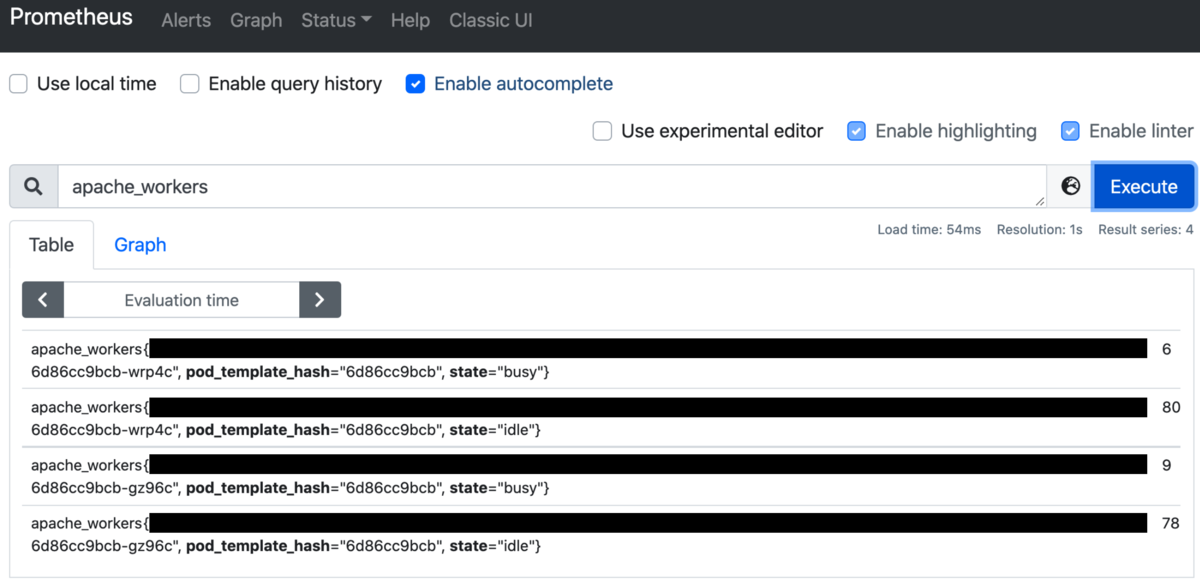
Prometheus ServerのWebUIからApache統計情報が取得できることを確認します。
$ kubectl --namespace=prometheus port-forward deploy/prometheus-server 9090
Prometheus Adapterのインストール
ここまででPrometheusに収集したメトリクスをKubernetesに連携するため、prometheus-adapterをインストールします。
チャートに渡す設定ファイルでは、こちらを参考に、 state="busy" な apache_workers を apache_busy_workers (プロセス数)として公開します。
rules:
  custom:
  - seriesQuery: 'apache_workers{kubernetes_namespace!="",kubernetes_pod_name!="",state="busy"}'
    resources:
      overrides:
        kubernetes_namespace: {resource: "namespace"}
        kubernetes_pod_name: {resource: "pod"}
    name:
      as: "apache_busy_workers"
    metricsQuery: 'sum(<<.Series>>{<<.LabelMatchers>>,state="busy"}) by (<<.GroupBy>>)'

prometheus:
  url: http://prometheus-server
  port: 80
  path: "/"
$ helm upgrade -i prometheus-adapter prometheus-community/prometheus-adapter \
    --namespace prometheus \
    --values config.yaml
$ helm ls -n prometheus
NAME                    NAMESPACE       REVISION        UPDATED                                 STATUS          CHART                           APP VERSION
prometheus              prometheus      1               2021-06-29 17:08:33.697191 +0900 JST    deployed        prometheus-14.3.0               2.26.0
prometheus-adapter      prometheus      1               2021-06-30 15:38:14.160989 +0900 JST    deployed        prometheus-adapter-2.14.2       v0.8.4
カスタムメトリクスAPIから apache_busy_workers が取得できることを確認します。
この例では、2つのApacheサーバでそれぞれ9つ、6つのプロセスが起動していることがわかります。
$ kubectl get --raw /apis/custom.metrics.k8s.io/v1beta1/namespaces/<namespace>/pods/*/apache_busy_workers | jq
{
  "kind": "MetricValueList",
  "apiVersion": "custom.metrics.k8s.io/v1beta1",
  "metadata": {
    "selfLink": "/apis/custom.metrics.k8s.io/v1beta1/namespaces/<namespace>/pods/%2A/apache_busy_workers"
  },
  "items": [
    {
      "describedObject": {
        "kind": "Pod",
        "namespace": "<namespace>",
        "name": "<pod-name>",
        "apiVersion": "/v1"
      },
      "metricName": "apache_busy_workers",
      "timestamp": "2021-07-05T11:15:11Z",
      "value": "9",
      "selector": null
    },
    {
      "describedObject": {
        "kind": "Pod",
        "namespace": "<namespace>",
        "name": "<pod-name>",
        "apiVersion": "/v1"
      },
      "metricName": "apache_busy_workers",
      "timestamp": "2021-07-05T11:15:11Z",
      "value": "6",
      "selector": null
    }
  ]
}
プロセス数で水平オートスケール
最後にHPAで全Apacheサーバのプロセス数平均を基準としたオートスケールの設定を行います。
ここでは平均プロセス数 75 を閾値に指定します。
apiVersion: autoscaling/v2beta2
kind: HorizontalPodAutoscaler
metadata:
  name: apache
spec:
  scaleTargetRef:
    apiVersion: apps/v1
    kind: Deployment
    name: apache
  minReplicas: 2
  maxReplicas: 5
  metrics:
  - type: Pods
    pods:
      metric:
        name: apache_busy_workers
      target:
        type: AverageValue
        averageValue: 75
これでプロセス数の増減に応じてDeployment apache がオートスケールするようになりました。
$ kubectl get hpa -n lms  # 2つのApacheでプロセス数がそれぞれ9つ、6つの場合
NAME     REFERENCE           TARGETS    MINPODS   MAXPODS   REPLICAS   AGE
apache   Deployment/apache   7500m/75   2         5         2          173m